Social Media Analytics Dashboard
Interactive Power BI dashboard tracking engagement metrics, follower growth, and content performance across multiple social media platforms
Project Overview
Developed a comprehensive Power BI dashboard to monitor and analyze social media performance across Facebook, Instagram, LinkedIn, and Twitter. The dashboard provides real-time insights into follower growth, engagement metrics, content performance, and demographic data to drive data-informed social media strategies.
Challenge
Social media managers needed a centralized view of performance metrics across multiple platforms. Manual tracking in spreadsheets was time-consuming, and insights were often outdated. The team required real-time analytics to make quick decisions about content strategy and posting schedules.
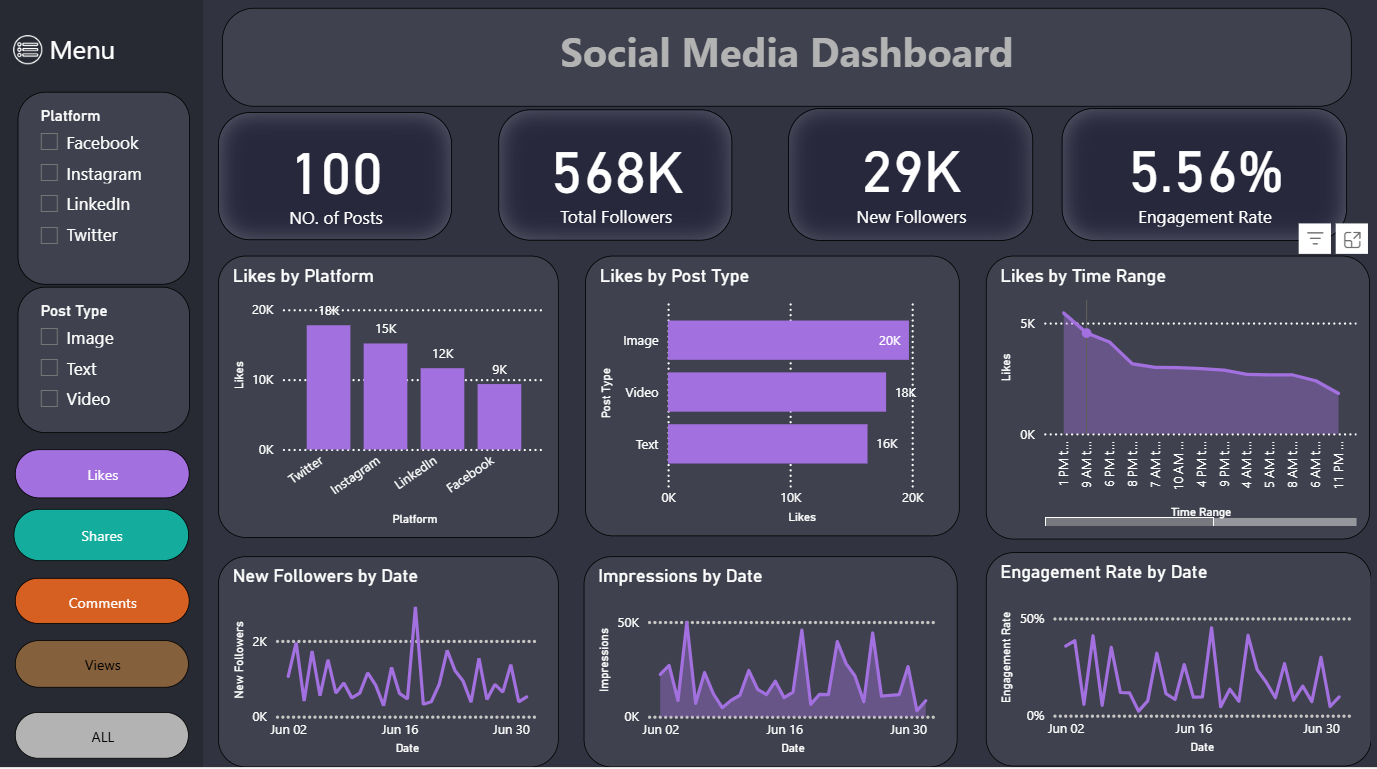
Main dashboard view with KPIs, platform comparison, and engagement trends over time
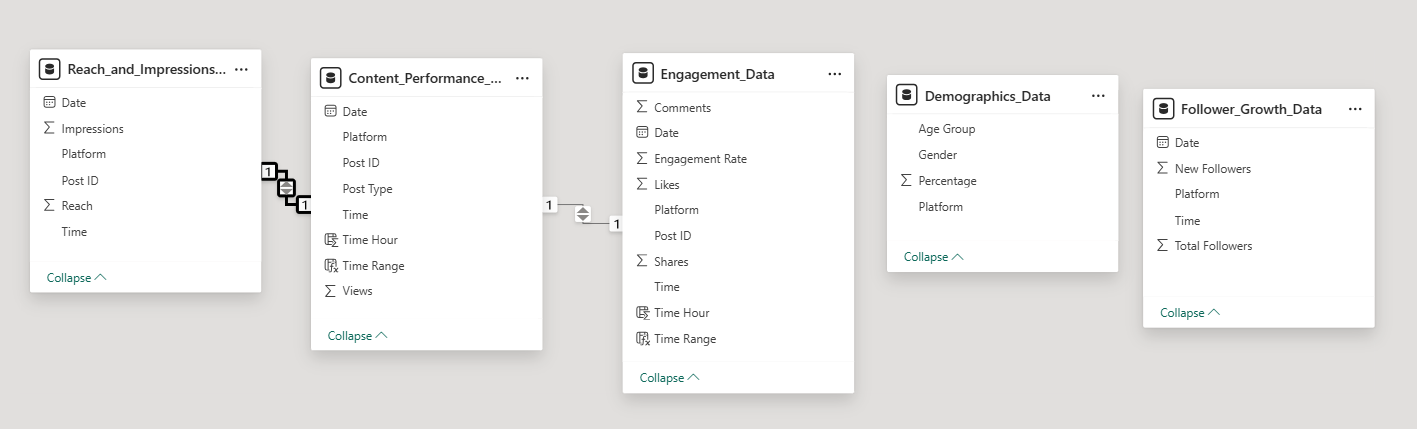
Data model structure showing relationships between engagement, demographics, and follower growth tables
Technical Approach
Data Model Design
Designed a star schema data model with 5 main tables to efficiently organize social media data:
- Reach_and_Impressions: Track post reach, impressions, and platform metrics
- Content_Performance: Monitor post performance by type, platform, and time
- Engagement_Data: Analyze likes, comments, shares, and engagement rates
- Demographics_Data: Store audience demographics by age group and gender
- Follower_Growth_Data: Track new followers and total follower counts over time
DAX Measures & Calculations
Created advanced DAX measures for dynamic KPI calculations and time intelligence:
- Engagement Rate = (Likes + Comments + Shares) / Total Followers
- Time-based comparisons (MoM, WoW growth rates)
- Running totals for follower growth trends
- Platform-specific performance metrics
Interactive Visualizations
Built an intuitive dashboard with filtering capabilities and drill-down features:
- Platform Filters: Toggle between Facebook, Instagram, LinkedIn, Twitter
- Post Type Analysis: Compare performance of Image, Video, and Text posts
- Time Range Selection: View metrics across different date ranges
- Metric Views: Switch between Likes, Shares, Comments, and Views
Dashboard Publishing & Sharing
Published to Power BI Service with public access for stakeholder viewing:
- Configured row-level security for sensitive data
- Set up automatic data refresh schedules
- Embedded dashboard link for easy access
- Optimized for mobile viewing
Key Features
📊 Multi-Platform Analytics
Consolidated view of Facebook, Instagram, LinkedIn, and Twitter metrics in one dashboard. Compare performance across platforms to identify which channels drive the most engagement.
📈 Real-Time KPI Tracking
Monitor critical metrics including total followers (568K), new followers (29K), engagement rate (5.56%), and total posts (100) with automatic updates as new data arrives.
🎯 Content Performance Analysis
Track which post types (Image: 20K likes, Video: 18K likes, Text: 16K likes) perform best and identify optimal posting times based on historical engagement patterns.
📅 Time-Series Trends
Visualize follower growth, impressions, and engagement rates over time to identify patterns and the impact of marketing campaigns on audience growth.
🎛️ Interactive Filters
Dynamic slicers for platform, post type, and time range enable users to drill down into specific segments and explore data from multiple perspectives.
👥 Demographics Insights
Analyze audience composition by age group and gender to better understand who is engaging with content and tailor future posts accordingly.
Technical Stack
BI Platform
- Power BI Desktop
- Power BI Service
- Power BI Mobile
Data Processing
- Power Query (M Language)
- DAX (Data Analysis Expressions)
- Data modeling
Visualization
- Bar charts & line graphs
- KPI cards
- Slicers & filters
Publishing
- Public web embedding
- Scheduled refresh
- Shareable links
Results & Impact
📊 Data-Driven Decisions
- Identified Instagram as top performer (18K likes)
- Optimized posting schedule based on engagement trends
- Discovered image posts generate 11% more engagement
- Tracked 29K new follower growth effectively
⏱️ Time Savings
- Eliminated manual report generation
- Real-time updates vs. weekly reports
- One-click filtering replaces multiple spreadsheets
- Automatic data refresh saves 10+ hours/week
📈 Business Value
- 5.56% average engagement rate maintained
- Clear visibility into 568K follower base
- Platform comparison drives budget allocation
- Demographics guide content personalization
Need a Custom Analytics Dashboard?
I can build interactive Power BI, Tableau, or custom dashboards tailored to your business metrics and KPIs.