SmogNet: Realtime Air Quality Intelligence System
An interpretable air-quality intelligence system for Pakistan's pollution data — detecting abnormal spikes, explaining probable sources, and turning raw pollutant readings into public health alerts people can actually act on.
🏆 Winner — 1st Prize, SmogNet Datathon
Project Overview
Smog episodes are not just numbers on a chart — they affect school days, commutes, outdoor workers, and people with heart or lung conditions. SmogNet was built to read pollution data the way a public-health team would: not only asking whether a pollutant is high, but whether it is unusually high for that city, season, and historical context.
The system answers four practical questions:
- When did pollution become abnormal for this city and season?
- Which pollutant pattern most likely explains the spike?
- How severe is the event compared with historical behavior?
- What should the public be told right now?
Challenge
Air quality data from Pakistani monitoring sources is messy and unlabeled. Column schemas were inconsistent, city names sometimes lived in filenames rather than a city column, and pollutant naming varied across files (PM2.5, PM25, ozone, components_*).
There were no ground-truth labels for either anomaly events or pollution sources, which ruled out a supervised classifier without inventing artificial labels. Extreme readings could not simply be dropped as outliers, because high values are often the very events the system needs to catch. A single fixed pollution threshold also fails across a country where Lahore in winter, Karachi in summer, and Quetta in another season all behave differently.
Approach — Adaptive Spike Detection
Rather than a fixed cutoff, SmogNet learns each city's local behavior from training data. The core anomaly score is a robust z-score built on rolling statistics:
score = (x − rolling median) / max(rolling IQR, ε)Severity thresholds are learned from training-score quantiles rather than hardcoded:
moderate = q0.95 · high = q0.975 · severe = q0.99
Baselines are learned per city + season, with a graceful fallback chain when a group has too little history:
city + season → city → global + season → globalProbable Source Classification
Because the dataset has no confirmed source labels, SmogNet uses transparent, rule-based pollutant fingerprints and deliberately reports a probable source rather than a confirmed cause.
| Signature | Probable source |
|---|---|
| NH₃ + CO elevated | Crop burning |
| NO + NO₂ elevated | Vehicular emissions |
| SO₂ elevated | Industrial emissions |
| High PM10 / PM2.5 ratio | Dust event |
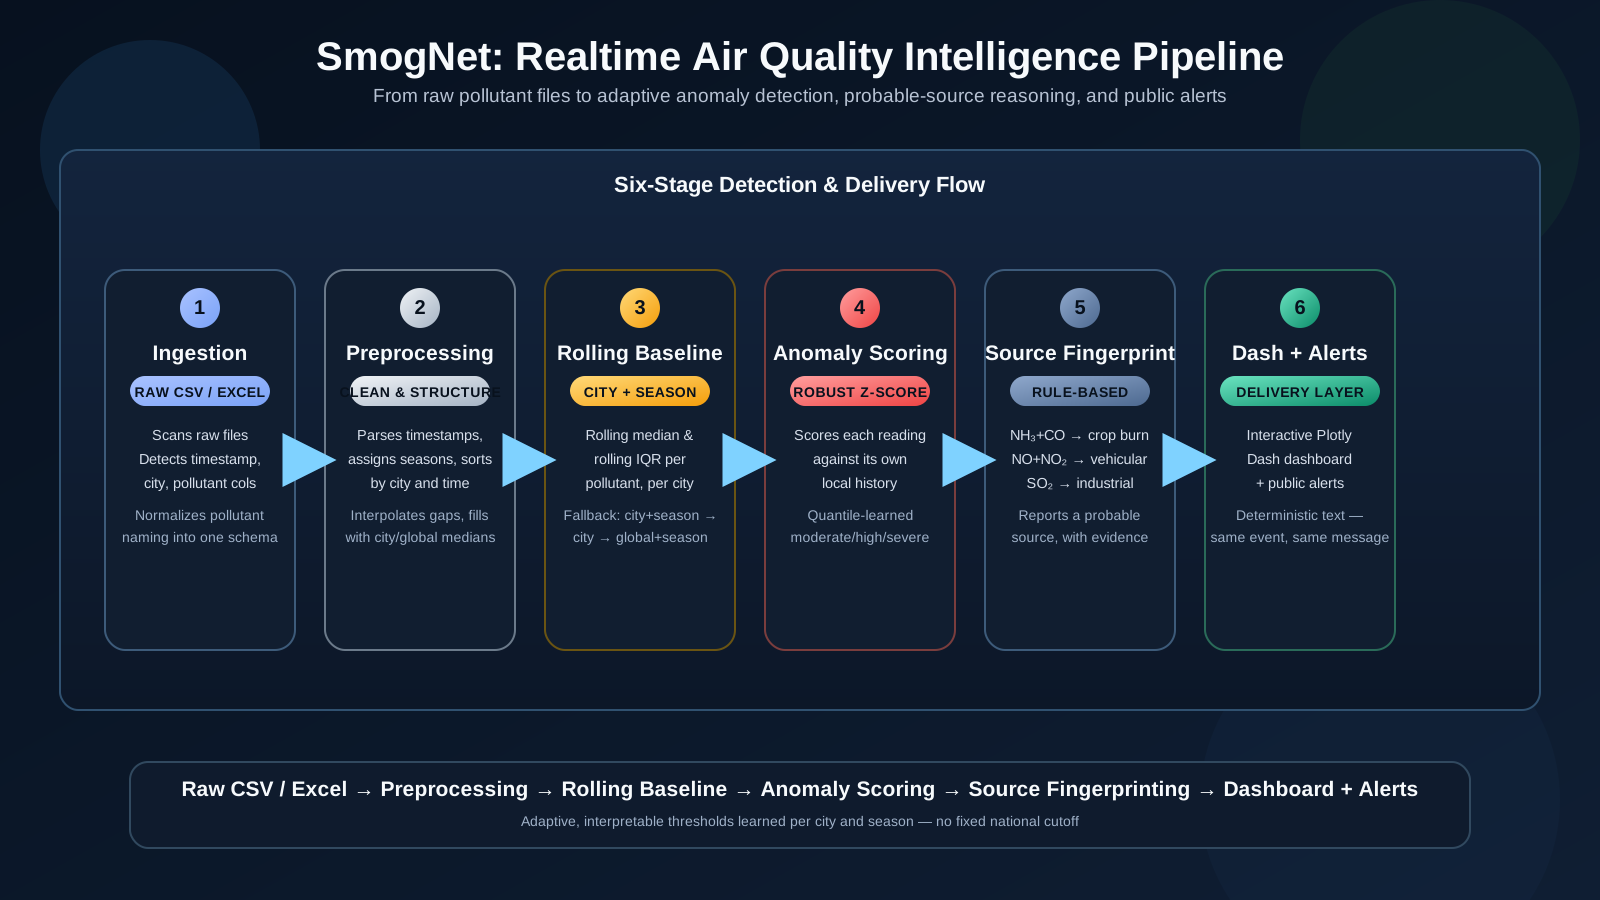
Pipeline Architecture
1. Ingestion
Scans raw CSV and Excel files, auto-detects timestamp, city, and pollutant columns, and normalizes inconsistent pollutant names into a single schema.
2. Preprocessing
Parses timestamps, assigns seasons, sorts by city and time, interpolates missing pollutant values within each city, and fills remaining gaps with city-level and global medians.
3. Detection
Computes rolling medians and rolling IQRs per pollutant, learns city-season baselines from training data only, and scores every reading against its own local history.
4. Source Reasoning
Applies interpretable pollutant fingerprints to each detected spike and returns a probable source with the supporting evidence.
5. Delivery
An interactive Plotly Dash dashboard plus deterministic public alert generation, so the same event always produces the same validated message.
Dashboard
The dashboard lets users explore spikes by city, pollutant, severity, source, and date. It surfaces KPI cards, pollutant trend charts with anomaly markers, source breakdown summaries, city-to-city comparison, generated public alerts, and a simulated near-real-time prediction panel.
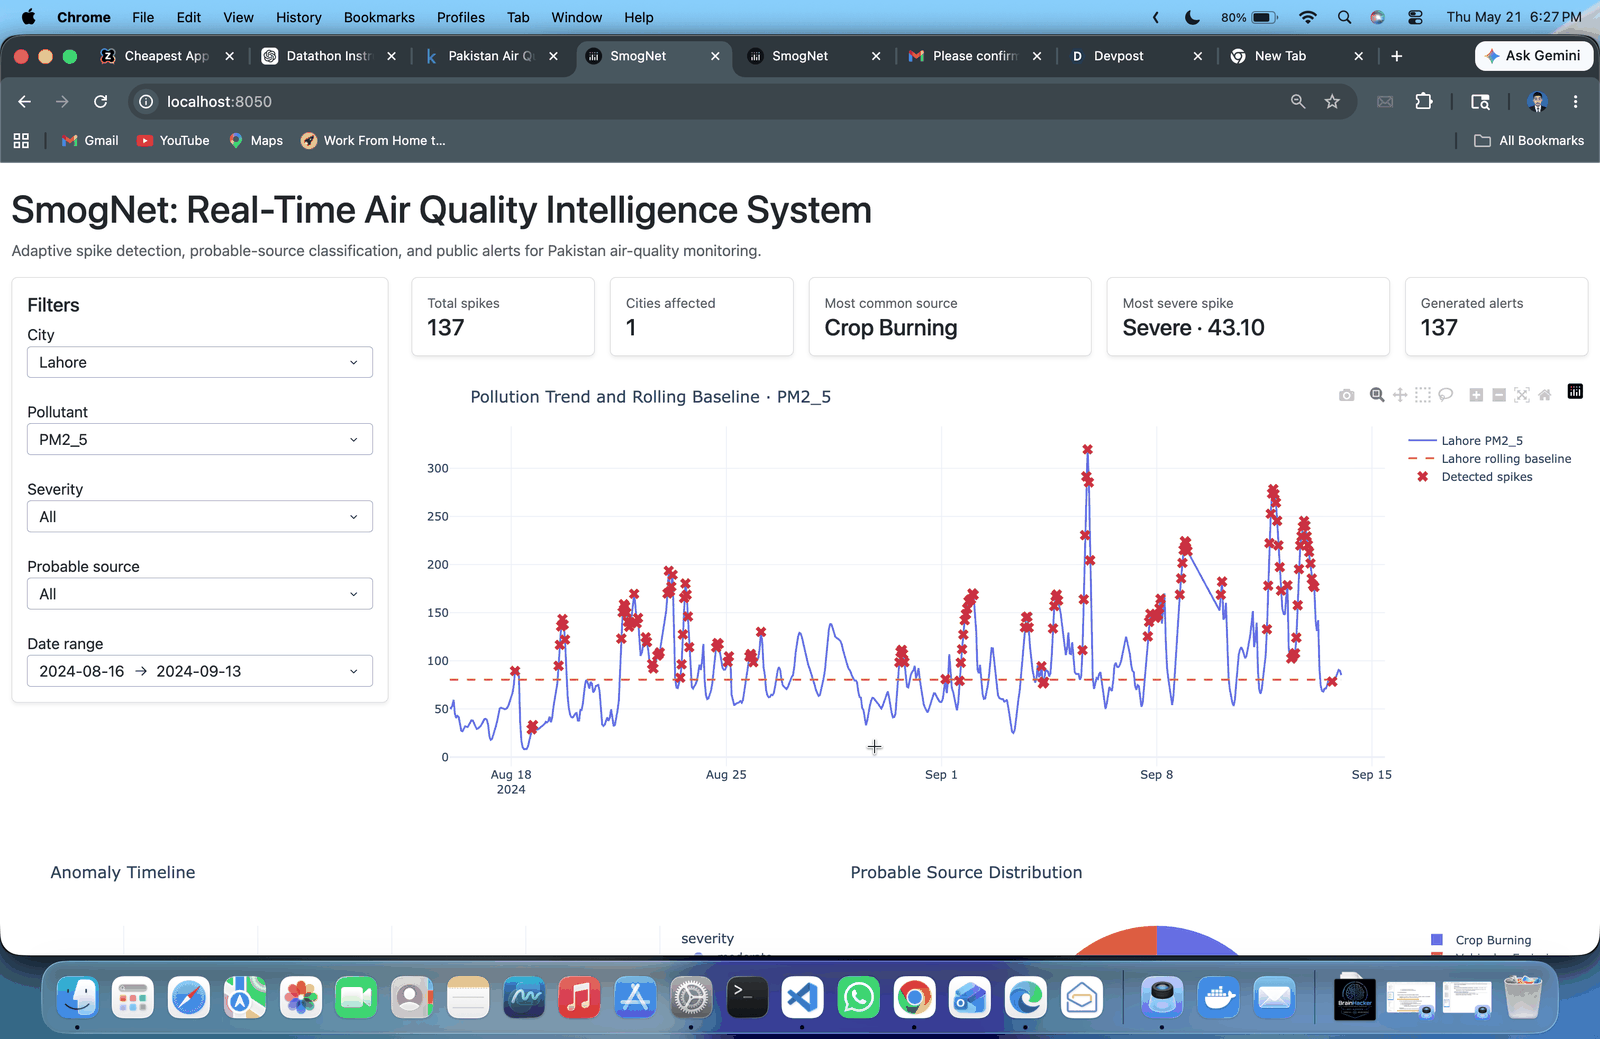
SmogNet dashboard showing air quality KPIs, pollutant trend charts, and anomaly markers.
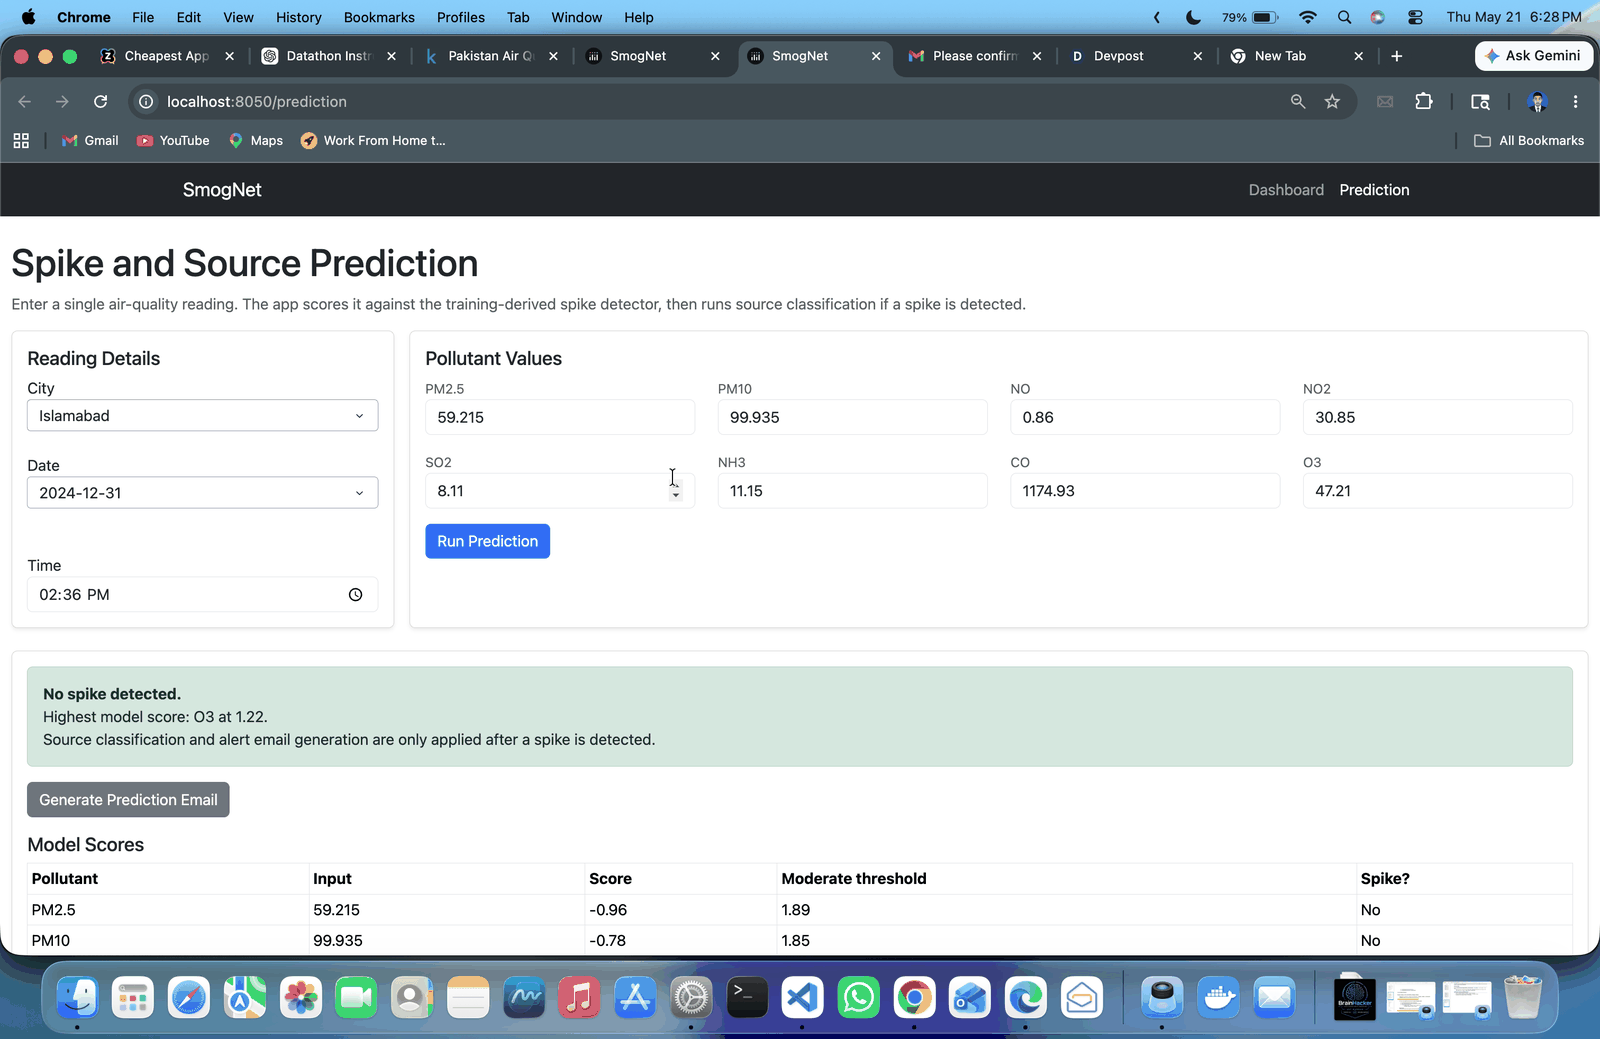
Simulated near-real-time prediction panel for upcoming pollutant readings.
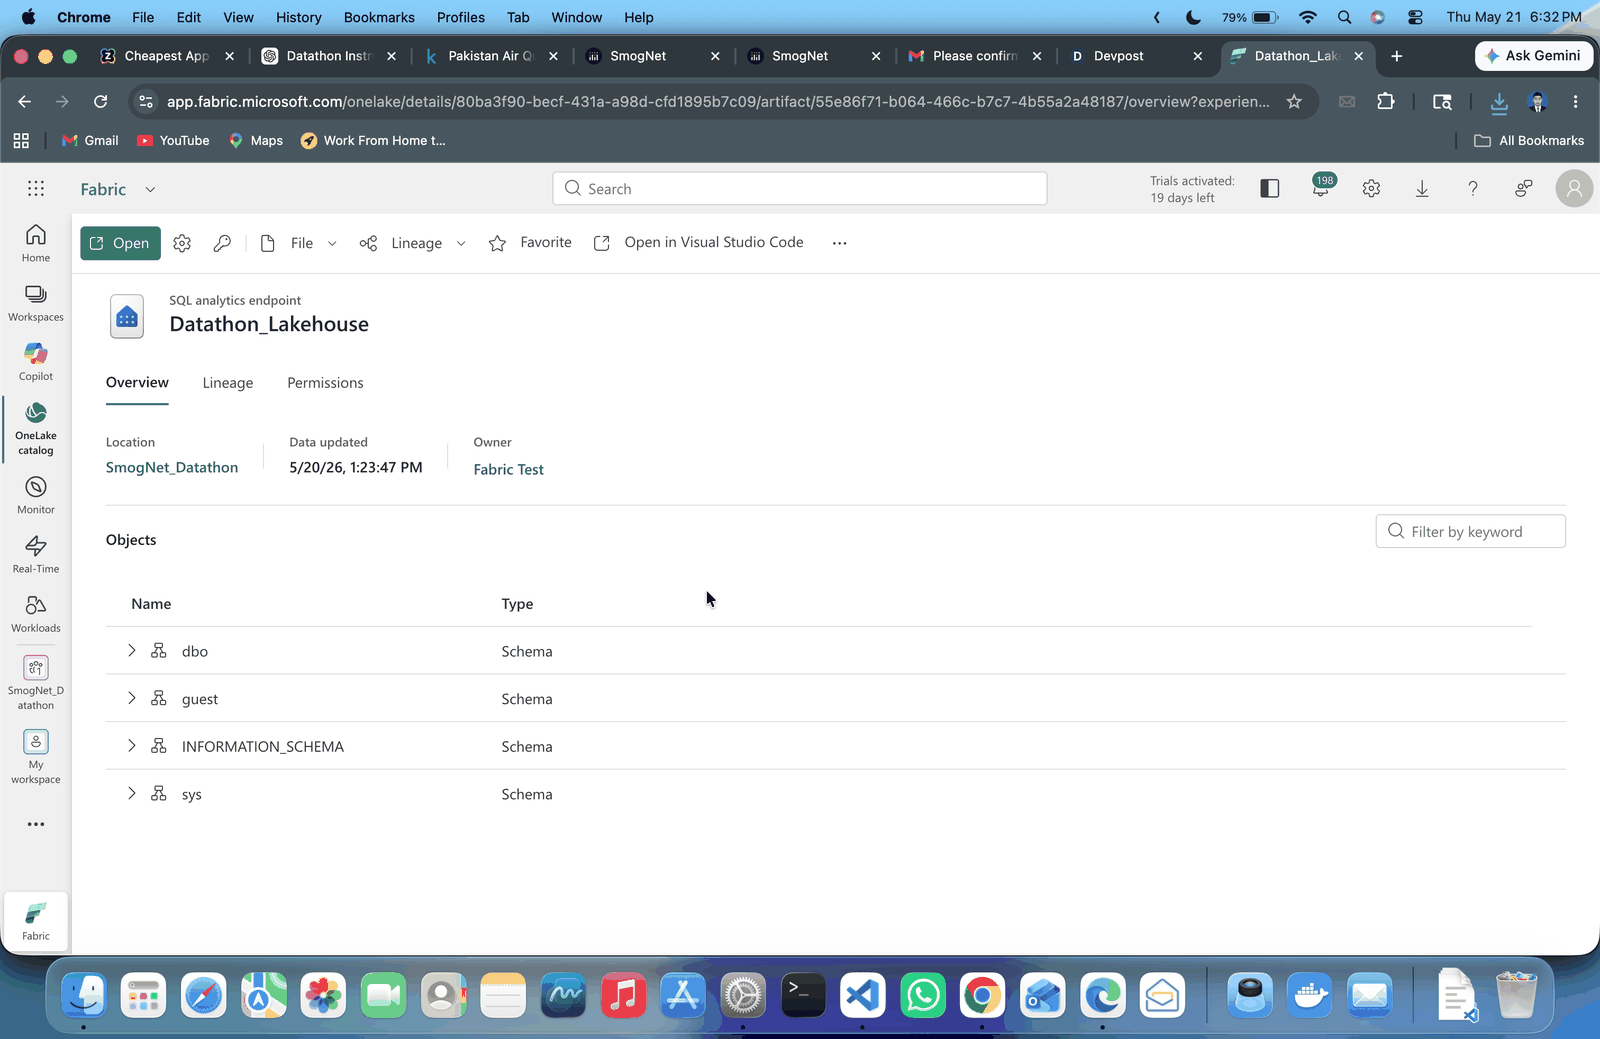
Data lakehouse architecture powering SmogNet inside Microsoft Fabric.
Technical Stack
Data Engineering
- Microsoft Fabric
- PyArrow
- openpyxl
- Pandas
- SQL
Modeling & Detection
- NumPy
- scikit-learn
- Rolling median/IQR statistics
- Quantile-learned thresholds
Explainability
- Rule-based pollutant fingerprints
- Evidence-backed probable-source output
Visualization
- Plotly Dash
- Dash Bootstrap Components
- KPI cards
- Anomaly-marked trend charts
Results & What's Next
Delivered
A complete workflow from raw files to processed data, spike detection, probable source classification, public alerts, and an interactive dashboard — not a notebook experiment. Awarded 1st Prize at the SmogNet Datathon.
Roadmap
Live API ingestion from air quality monitors, weather and wind data, satellite hotspot feeds, traffic indicators and industrial-area context for stronger source reasoning; public deployment, automated alert delivery, multilingual public messages, and validation against confirmed pollution episodes once labeled event data is available.
Need this project or need this type of service?
Get in touch if you want a similar anomaly detection system, analytics dashboard, or end-to-end data science solution.
Get in touch