Sales Analytics Dashboard
Comprehensive Power BI dashboard providing end-to-end sales analytics, customer insights, inventory management, and marketing campaign performance tracking
Project Overview
Developed a comprehensive Power BI sales analytics solution that consolidates data from multiple sources to provide actionable insights across sales performance, customer segmentation, inventory management, and marketing campaign effectiveness. The dashboard serves as a central hub for data-driven decision making across the organization.
Business Challenge
The sales team struggled with fragmented data across multiple systems, making it difficult to get a holistic view of business performance. Key stakeholders needed real-time visibility into sales trends, customer behavior, inventory levels, and marketing ROI to make informed strategic decisions. Manual reporting processes were time-consuming and often provided outdated insights.
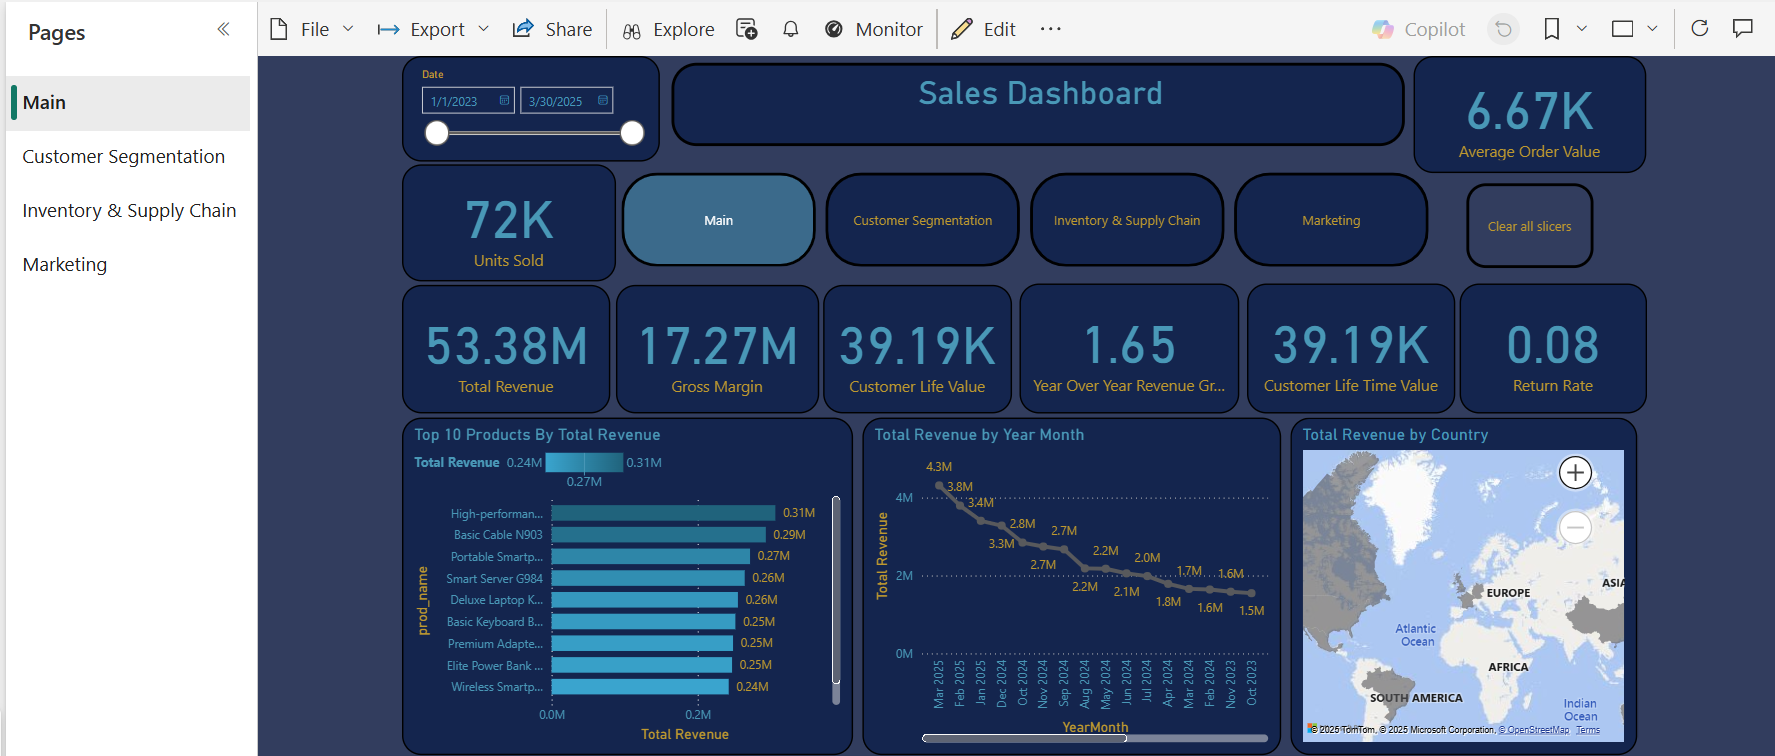
Main dashboard view with comprehensive KPIs, product performance analysis, revenue trends, and geographical insights
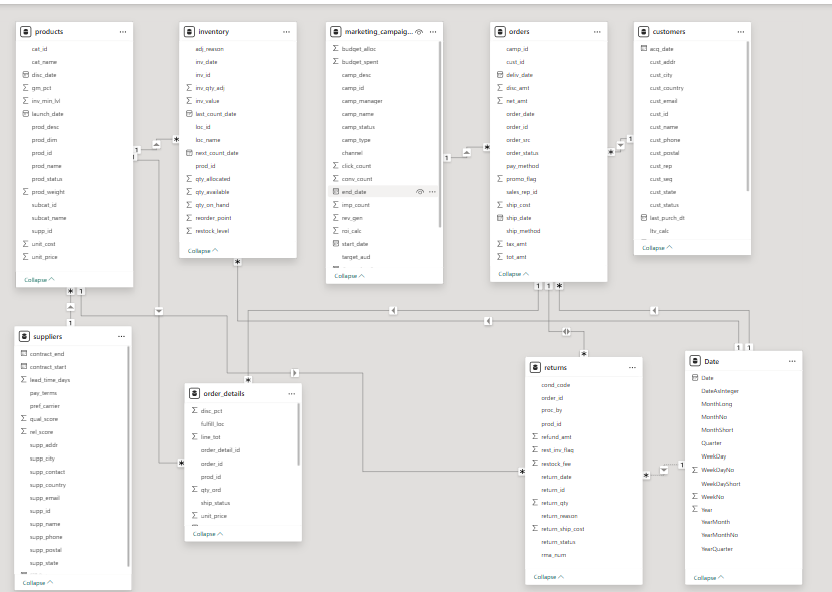
Comprehensive data model with 9 tables including products, orders, customers, inventory, marketing campaigns, and supporting dimensions
Technical Approach
Data Model Architecture
Designed a star schema data model with 9 interconnected tables to support comprehensive sales analytics:
- Products: Product catalog with 17 attributes including pricing, inventory levels, categories, and supplier information
- Orders: Transaction records with customer, payment, shipping, and campaign tracking
- Customers: Customer master data with demographics, segmentation, and calculated metrics (CLV, frequency, spend patterns)
- Inventory: Stock levels, reorder points, valuations, and inventory adjustments
- Marketing Campaigns: Campaign details with budget tracking, performance metrics (impressions, clicks, conversions), and ROI calculations
- Order Details: Line-level transaction details with pricing and discounts
- Suppliers: Vendor management with contract and lead time tracking
- Returns: Product returns with condition codes and refund tracking
- Date: Calendar table with hierarchies (Year, Quarter, Month, Week) for time intelligence
Advanced DAX Measures
Created sophisticated calculated measures for business intelligence:
- Revenue Metrics: Total Revenue, Gross Margin, Net Revenue, Average Order Value (AOV = $6.67K)
- Customer Analytics: Customer Lifetime Value ($39.19K), Customer Count, Frequency, Spend, Segmentation
- Growth Analysis: Year-over-Year Revenue Growth (1.65), Month-over-Month comparisons, Running totals
- Operational KPIs: Units Sold (72K), Return Rate (0.08), Gross Margin ($17.27M)
- Marketing ROI: Campaign Revenue, Campaign ROI, Budget utilization, Conversion tracking
- Time Intelligence: YTD, QTD, MTD calculations with previous period comparisons
Multi-Page Dashboard Design
Built a comprehensive 4-page dashboard covering all business dimensions:
- Main Page: Executive overview with top 10 products, revenue trends by month, geographic distribution, and key KPIs
- Customer Segmentation: RFM analysis, CLV distribution, customer cohort analysis, churn prediction indicators
- Inventory & Supply Chain: Stock levels, reorder alerts, supplier performance, inventory turnover, lead time analysis
- Marketing: Campaign performance dashboard with budget vs. actual, ROI analysis, channel effectiveness, conversion funnels
- Interactive Filters: Date range slicers (1/1/2023 - 3/30/2025), product categories, customer segments, regions
Deployment & Data Refresh
Published dashboard to Power BI Service with optimized performance and data governance:
- Configured incremental refresh for large datasets to improve load times
- Set up scheduled daily refresh at 6 AM for latest data
- Implemented row-level security (RLS) for regional managers
- Created public embed link for stakeholder access
- Optimized DAX queries and data model size for faster rendering
- Established data governance policies and documentation
Key Features
📊 360° Sales Analytics
Complete visibility into sales performance with $53.38M total revenue tracking, 72K units sold, and drill-down capabilities from high-level KPIs to individual transaction details. Top 10 products analysis reveals best performers with granular revenue breakdowns.
👥 Customer Intelligence
Advanced customer segmentation with $39.19K average Customer Lifetime Value tracking, RFM (Recency, Frequency, Monetary) analysis, and behavioral cohort grouping. Identify high-value customers and optimize retention strategies based on data-driven insights.
📈 Trend Analysis & Forecasting
Time-series visualization of revenue trends by month with seasonal pattern identification. Year-over-Year growth tracking (1.65 multiplier) enables performance comparisons and strategic planning with historical context from Jan 2023 to March 2025.
🗺️ Geographic Insights
Interactive world map showing revenue distribution by country with color-coded intensity. Regional performance comparison helps identify expansion opportunities and optimize regional strategies. Includes drill-through to country-specific metrics.
📦 Inventory Management
Real-time inventory tracking with stock level monitoring, reorder point alerts, and supplier lead time analysis. Prevent stockouts and optimize working capital with automated inventory turnover calculations and valuation metrics.
🎯 Marketing Campaign ROI
Comprehensive marketing analytics tracking campaign performance, budget utilization, ROI calculation, and conversion metrics. Monitor impressions, clicks, and revenue generated by each campaign to optimize marketing spend allocation.
💰 Profitability Analysis
Detailed profit margin analysis with $17.27M gross margin tracking (32.4% margin rate). Calculate contribution margins by product, category, customer segment, and region to identify the most profitable business areas.
↩️ Returns & Quality Monitoring
Track return rates (0.08 overall) by product, reason, and time period to identify quality issues and improve product satisfaction. Analyze return patterns to reduce costs and enhance customer experience.
Technical Stack
BI Platform
- Power BI Desktop
- Power BI Service
- Power BI Gateway
Data Processing
- Power Query (M Language)
- DAX (Data Analysis Expressions)
- SQL for data extraction
Data Modeling
- Star schema design
- Calculated columns & measures
- Relationship management
Visualization
- Bar charts, line graphs, maps
- KPI cards & gauges
- Custom visuals & themes
Results & Impact
📊 Data-Driven Insights
- Identified top 10 revenue-generating products ($0.31M leader)
- Discovered seasonal revenue patterns for demand planning
- Revealed high-value customer segments worth $39.19K average CLV
- Tracked 1.65 YoY revenue growth for strategic validation
⏱️ Efficiency Gains
- Eliminated 15+ hours/week of manual reporting
- Real-time data updates vs. weekly static reports
- Automated KPI calculations with DAX measures
- Single source of truth for all stakeholders
💼 Business Value
- $53.38M total revenue visibility and tracking
- $17.27M gross margin monitored in real-time
- 0.08 return rate tracking enables quality improvements
- Marketing ROI optimization through campaign analytics
Need a Custom Sales Dashboard?
I can build comprehensive Power BI dashboards tailored to your sales, customer, and operational metrics.