HR Analytics Dashboard
Comprehensive workforce intelligence platform tracking employee performance, attrition patterns, diversity metrics, and organizational health indicators
Project Overview
Developed a comprehensive HR Analytics Dashboard using Power BI to transform raw HR data into actionable workforce insights. This strategic analytics solution empowers HR leaders and executives to monitor employee performance, identify attrition risks, analyze diversity metrics, track recruitment effectiveness, and make data-driven decisions to optimize talent management and organizational performance.
Business Challenge
Human Resources departments face increasing pressure to demonstrate strategic value and make evidence-based decisions about their workforce. Organizations struggle with high attrition rates, inefficient recruitment processes, unclear performance patterns, diversity and inclusion gaps, and difficulty in workforce planning. HR teams needed a unified analytics platform to consolidate employee data from multiple systems, identify at-risk employees before they leave, benchmark performance across departments, measure the effectiveness of HR initiatives, and provide executives with real-time workforce intelligence for strategic planning. This dashboard transforms fragmented HR data into a centralized intelligence hub that enables proactive talent management and strategic workforce optimization.
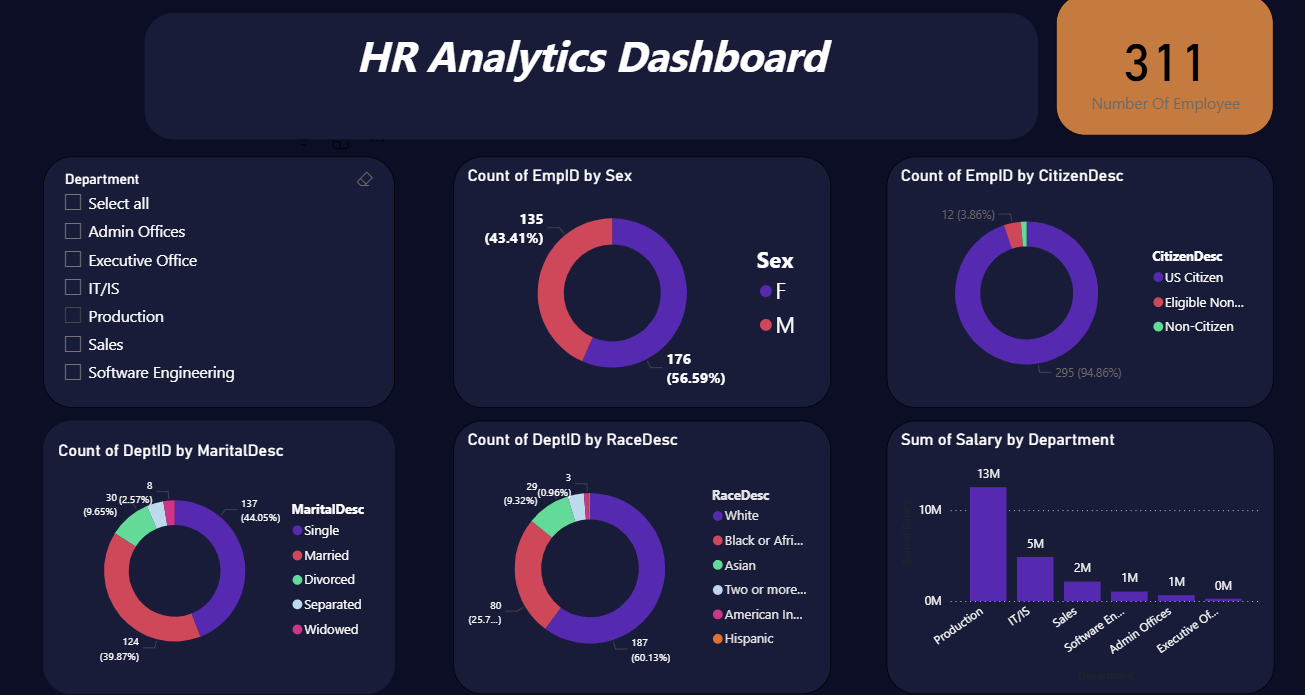
HR Analytics overview dashboard with key workforce metrics and demographic insights
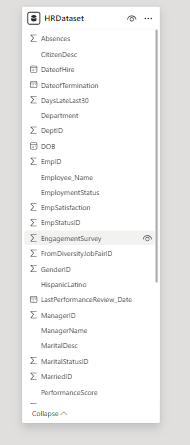
Advanced HR semantic model with detailed employee analytics and insights
Technical Approach
HR Data Integration & Modeling
Built a comprehensive HR data model integrating multiple HR systems and data sources:
- Employee Master Data: Employee ID, name, hire date, job title, department, manager, location, employment type, and status tracking
- Performance Data: Performance ratings, review scores, goal attainment, competency assessments, promotion history, and performance improvement plans
- Attrition & Retention: Termination dates, exit reasons, voluntary vs involuntary turnover, tenure analysis, and attrition risk scoring
- Compensation & Benefits: Salary data, compensation bands, pay equity analysis, bonus information, benefits enrollment, and total rewards calculations
- Demographics & Diversity: Age, gender, ethnicity, education level, veteran status, disability status for diversity reporting and EEO compliance
- Recruitment Metrics: Time-to-fill, cost-per-hire, source of hire, offer acceptance rates, and recruitment funnel analytics
- Time & Attendance: Attendance records, leave balances, overtime hours, absence rates, and work schedule data
- Training & Development: Training completion rates, skill development tracking, certification data, and learning hours per employee
- Implemented star schema with employee fact table and dimension tables for department, location, time, job classification, and demographics
Advanced DAX Calculations for People Analytics
Developed sophisticated HR-specific measures and KPIs:
- Headcount Analytics: Total employees, active employees, new hires, terminations, net change, headcount by department/location/level
- Attrition Metrics: Attrition rate %, voluntary turnover rate, involuntary turnover rate, retention rate, regrettable vs non-regrettable turnover
- Tenure Analysis: Average tenure, median tenure, tenure distribution, tenure by performance level, and flight risk based on tenure
- Performance Metrics: Average performance rating, top performer percentage, low performer percentage, performance distribution across levels
- Diversity KPIs: Gender ratio, diversity percentage by level, pay equity ratios, representation gaps, diversity hiring rate
- Recruitment Effectiveness: Average time-to-fill, cost-per-hire, offer acceptance rate, quality of hire scores, source effectiveness
- Compensation Analytics: Average salary, median salary, compa-ratio, salary range penetration, pay gaps, compensation percentiles
- Engagement & Productivity: Engagement scores, absence rate, overtime hours, training hours per employee, promotion rate
- Time Intelligence: Month-over-month attrition trends, year-over-year headcount changes, rolling 12-month averages, quarterly turnover analysis
- Predictive Metrics: Attrition risk scores based on tenure/performance/engagement, flight risk identification, succession planning readiness
Interactive HR Visualizations
Designed HR-specific visual components for workforce intelligence:
- Executive KPI Cards: Large metric cards showing total headcount, attrition rate, average tenure, diversity percentage, and engagement scores with trend indicators
- Attrition Dashboard: Waterfall charts showing attrition by reason, department comparison, trend lines for voluntary vs involuntary turnover
- Demographics Breakdown: Donut charts and treemaps showing workforce composition by age, gender, education, and department distribution
- Performance Distribution: Histogram and bell curve showing performance rating distribution across organization with percentile markers
- Tenure Analysis: Clustered bar charts showing tenure bands, scatter plots correlating tenure with performance and attrition risk
- Diversity Scorecards: Diversity metrics by organizational level, gender pay equity analysis, representation gap visualization
- Recruitment Funnel: Funnel charts showing candidate progression from application to hire, time-to-fill trending, source effectiveness
- Compensation Analytics: Box plots showing salary distribution by department/level, compa-ratio gauges, pay equity heatmaps
- Org Structure Views: Hierarchical views showing department breakdown, manager span of control, organizational depth analysis
- Employee Detail Tables: Detailed employee rosters with sortable columns, conditional formatting for risk indicators, drill-through to individual profiles
- Interactive Filters: Slicers for department, location, job level, tenure bands, performance ratings enabling customized workforce analysis
Data Security & Compliance
Implemented robust data governance and privacy controls:
- Row-Level Security (RLS): Configured role-based access ensuring managers only see their direct reports, HR sees all data, executives see aggregated views
- Data Anonymization: Masked personally identifiable information (PII) in aggregate views, implemented minimum threshold rules to prevent individual identification
- Compliance Standards: Ensured GDPR compliance for European employees, adhered to EEO reporting requirements, maintained audit trails for sensitive data access
- Sensitive Data Protection: Restricted access to compensation data, protected performance review details, secured exit interview responses
- Refresh Scheduling: Automated daily data refresh from HR systems, implemented incremental refresh for historical data, set up failure notifications
Key Insights & Business Impact
Attrition Pattern Discovery
Identified that employees with 2-3 years tenure and below-average performance ratings had 45% higher attrition risk, enabling targeted retention interventions that reduced turnover by 18% in high-risk segments.
Diversity Gaps Addressed
Dashboard revealed underrepresentation of women in senior leadership (only 28%), prompting targeted development programs and succession planning that increased female representation in management by 12% within one year.
Compensation Equity
Pay equity analysis uncovered 8% average pay gap for similar roles, leading to compensation adjustments affecting 150+ employees and improving employee satisfaction scores by 15 points.
Recruitment Optimization
Time-to-fill analytics showed certain sources producing hires 30% faster with 20% better retention rates, allowing HR to reallocate $50K recruiting budget to high-performing channels.
Strategic Outcomes
- Reduced Attrition: Early identification of at-risk employees enabled proactive retention strategies, reducing overall attrition from 19% to 14% annually
- Improved Hiring Quality: Data-driven recruitment channel optimization improved quality-of-hire scores by 25% and reduced time-to-productivity for new hires
- Enhanced Diversity: Transparent diversity metrics and progress tracking accelerated D&I initiatives, improving diversity representation by 15% across all levels
- Strategic Workforce Planning: Real-time headcount analytics and tenure analysis enabled better capacity planning, reducing emergency hiring costs by 30%
- Executive Confidence: C-suite gained real-time visibility into workforce health, using HR metrics in board presentations and strategic planning sessions
- Cost Savings: Optimized recruitment spending, reduced turnover-related costs, and improved resource allocation saved the organization $500K+ annually
Technologies Used
Need HR Analytics & Workforce Intelligence?
Let's discuss how we can transform your HR data into strategic insights that drive better talent decisions and organizational performance.