Ecommerce Sales Dashboard
Interactive Power BI dashboard providing comprehensive insights into ecommerce performance, product analytics, sales trends, and customer behavior for data-driven business decisions
Project Overview
Developed a sophisticated ecommerce analytics solution using Power BI to track online sales performance, analyze product trends, monitor customer behavior, and provide actionable insights for business growth. The dashboard consolidates data from multiple touchpoints to deliver a comprehensive view of the ecommerce operations.
Business Challenge
The ecommerce business faced challenges in understanding customer purchasing patterns, product performance across categories, and identifying revenue optimization opportunities. With growing online sales volume, stakeholders needed real-time visibility into key metrics such as sales trends, product popularity, payment preferences, and geographic distribution to make strategic decisions and improve operational efficiency.
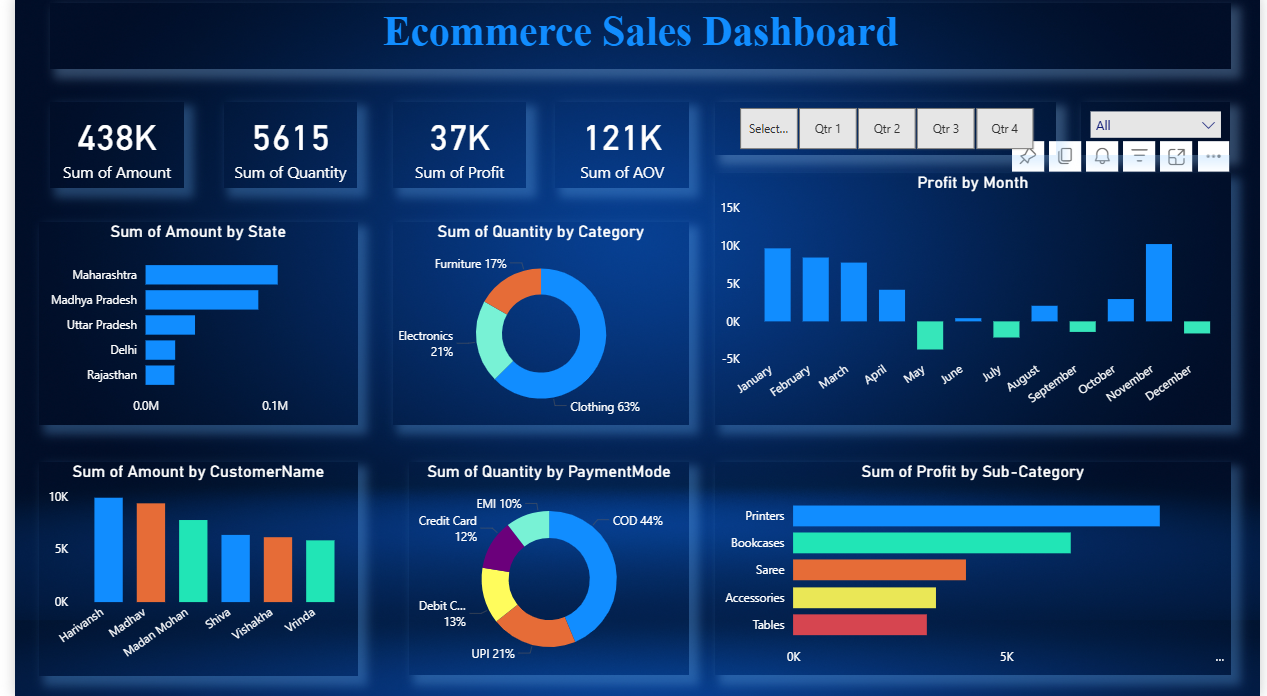
Comprehensive ecommerce dashboard with real-time KPIs, sales trends, product analytics, and customer behavior insights
Technical Approach
Data Integration & Modeling
Built a robust data model integrating multiple ecommerce data sources:
- Sales Transactions: Order details with timestamps, amounts, payment methods, and shipping information
- Product Catalog: Complete product master data with categories, subcategories, pricing, and inventory status
- Customer Data: Customer demographics, purchase history, and behavioral patterns
- Geographic Data: State, city, and regional information for location-based analysis
- Time Dimensions: Date hierarchies for time-series analysis and trend identification
- Established relationships and created calculated columns for enhanced analytics
Advanced DAX Calculations
Developed sophisticated measures for comprehensive ecommerce analytics:
- Revenue Metrics: Total sales, average order value, revenue by category, profit margins
- Customer Analytics: Customer count, purchase frequency, customer lifetime value, retention rate
- Product Performance: Top sellers, quantity sold by category, inventory turnover, product profitability
- Time Intelligence: Month-over-month growth, year-over-year comparisons, seasonal trends
- Payment Analysis: Payment method distribution, transaction success rates, average transaction by payment type
- Geographic Metrics: Sales by state, regional performance, shipping efficiency
Interactive Dashboard Design
Created an intuitive, user-friendly dashboard with multiple analytical views:
- Executive Summary: High-level KPIs with total sales, order count, profit, and key performance indicators
- Sales Analytics: Revenue trends over time, monthly/quarterly comparisons, sales forecasting
- Product Insights: Category performance, top products by revenue and quantity, product mix analysis
- Customer Behavior: Purchase patterns, customer segmentation, repeat purchase rates
- Geographic Distribution: Sales heatmap by state, regional performance comparison
- Interactive Filters: Date slicers, category filters, payment method selection, regional drilldowns
Deployment & Optimization
Published and optimized dashboard for performance and accessibility:
- Published to Power BI Service with embed capabilities for stakeholder access
- Configured scheduled refresh for real-time data updates
- Optimized report performance with query reduction and aggregation strategies
- Implemented responsive design for mobile and tablet viewing
- Created embedded view for integration into business portals
- Established data governance and security protocols
Key Features
📊 Real-Time Sales Tracking
Monitor live sales performance with automatic data refresh, tracking total revenue, order volume, and average order value. Instant visibility into business performance with up-to-date KPIs and trend indicators.
🛍️ Product Performance Analytics
Deep dive into product-level analytics with category breakdowns, bestseller identification, and inventory insights. Understand which products drive revenue and optimize product mix strategies based on data.
👥 Customer Insights
Analyze customer behavior patterns, segment customers by purchase frequency and value, and identify high-value customer groups. Track customer retention and lifetime value metrics for strategic planning.
📈 Trend Analysis & Forecasting
Visualize sales trends over time with month-over-month and year-over-year comparisons. Identify seasonal patterns, peak sales periods, and growth opportunities with advanced time intelligence.
🗺️ Geographic Analysis
Interactive map visualization showing sales distribution across states and cities. Identify top-performing regions, expansion opportunities, and optimize logistics based on geographic insights.
💳 Payment Method Analysis
Track payment preferences across different customer segments and product categories. Optimize payment gateway strategies and understand transaction patterns by payment type.
💰 Profitability Metrics
Calculate and monitor profit margins by product, category, and customer segment. Identify the most profitable business areas and optimize pricing strategies for maximum profitability.
🔍 Interactive Drill-Downs
Drill down from high-level summaries to detailed transaction records. Explore data hierarchies from annual performance to individual orders with seamless navigation and filtering capabilities.
Technical Stack
BI Platform
- Power BI Desktop
- Power BI Service
- Power BI Embedded
Data Processing
- Power Query (M Language)
- DAX (Data Analysis Expressions)
- SQL for data extraction
Data Modeling
- Star schema design
- Calculated columns & measures
- Relationship optimization
Visualization
- Interactive charts & graphs
- Geographic maps
- KPI cards & slicers
Results & Impact
📊 Business Intelligence
- Unified view of ecommerce performance metrics
- Identified top-performing products and categories
- Discovered customer purchasing patterns and preferences
- Geographic insights for expansion planning
⏱️ Operational Efficiency
- Eliminated manual reporting processes
- Real-time data updates vs. delayed reports
- Automated KPI tracking and alerting
- Self-service analytics for stakeholders
💼 Strategic Decisions
- Data-driven product assortment optimization
- Targeted marketing based on customer segments
- Improved inventory management decisions
- Regional strategy optimization
Need an Ecommerce Analytics Solution?
I can build custom Power BI dashboards to track your online sales, products, and customer metrics.